When was the last time you used data to look forward rather than back? Do you use data from your website analytics and CRM platforms to simply report on performance, or are you using it to make predictions about the future—and identify opportunities to intervene and shift forecast behaviors?
Propensity modeling allows you to make more use of your data, giving you a better understanding of the interactions and behaviors associated with an event: a prospect converting, a member canceling their subscription, a client adding an additional service to their plan.
In this post, we will take an introductory look at propensity modeling. We’ll explore what the process can look like using some synthetic data, discuss what these actionable outcomes might be, and reveal how to use these insights to drive additional value rather than just report on history.
The foundation: A comprehensive measurement plan
If you want to optimize performance (and who doesn’t?), it’s critical to ensure that your KPIs are not only measured against specific objectives but are tracked correctly. Metrics that result in an event being sent to another system of record—such as transactions and revenue—can be easily tracked using the destination system. But the real magic happens when you combine these events with data from the customer-facing application, thus enriching metrics through the context of user behavior.
By tracking all points of customer interaction through the purchase journey (which pages or screens were viewed, which creatives were displayed, which menus were expanded, etc.), conversions and revenue can be associated with user behaviors. This creates opportunities to not only to report but uncover opportunities to: enhance user experience (UX) through personalization; improve conversion rates or average order values; and reduce user churn.
Ensuring that all user interactions with a digital product are recorded along with the conversion metrics provides a dataset that can be used to apply statistical modeling to application use. These models give us a better understanding the user behaviors associated with particular actions, allowing intervention strategies to be designed and tested to shift the likelihood of these predicted events. Propensity modelling is one such technique to use these data to understand how user behaviors are predictive of particular outcomes.
The fundamentals of propensity modeling
Propensity modeling is an umbrella term used to describe the use of statistical approaches to understand how particular user actions may be predictive of certain events. For example, by tracking the pages viewed by the user of a digital product—and analyzing these against the outcome of order value—we may find that visits with a view of a “People who bought this also bought…” page are more likely to include an add-on sale than visits that don’t. As a result, we could design a test to investigate whether bringing information from that page into more user journeys can increase the additional sales.
A number of statistical approaches can be applied to build propensity models, with the choice of model dependent on the structure and distribution of the data and the format of the desired output. For example, regression modeling may be the best choice for understanding the effect of particular touch points on the likelihood of a specific conversion event; in contrast, a machine learning approach (such as a classification tree) may be more appropriate for understanding which choice of several a user may make.
Examples of propensity model use cases
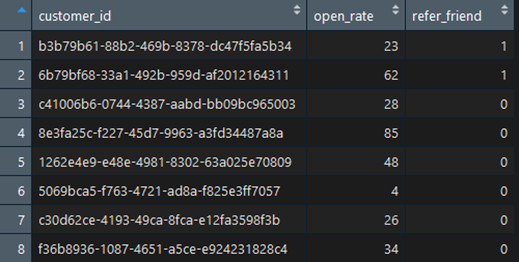
Let’s start with a straightforward example. These example data show the email open rate of 1,000 customers—and whether or not they referred a friend:

What we are interested in understanding is the probability that a customer, with a given email open rate, will refer a friend to our service.
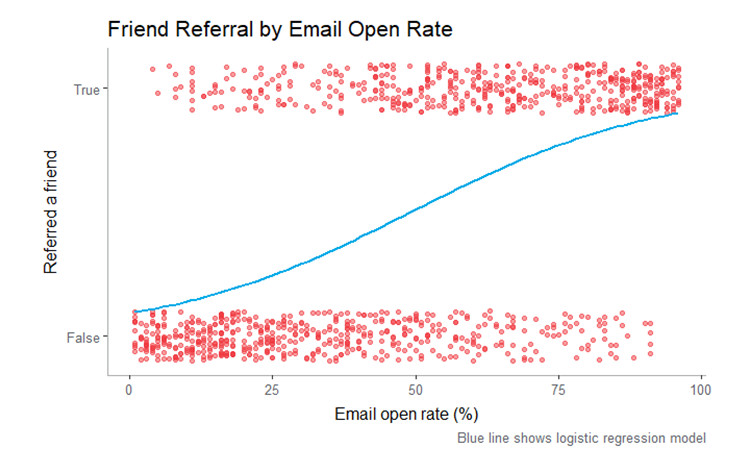
In our dataset, the friend referral is given as a 1 if the existing customer referred a friend and a 0 if they didn’t. If we calculate the median open rate for the two groups of customers, we see an open rate of 28% for those who didn’t refer a friend and 66% for those who did. We can already start to see that customers that refer friends have higher email open rates.
To calculate the probability of a customer referring a friend, we will use a technique known as logistic regression. Unlike linear regression, a logistic regression allows us to look at a binary response—in this case, whether or not a customer referred a friend. If we look at the customers on a graph that plots the refer-a-friend event against the email open rate, we see the number of customers increases with open rate for those that did refer a friend, and decreases for those who did not.

The logistic regression line is bound by 0 and 1, as those are the limits of the probability. Using this model, we can then work backwards and predict, for customers with a given email open rate, the likelihood of them referring a friend.
Of course, this is a very straightforward example, and doesn’t tell us much we wouldn’t be able to see from a simple summary of the data. The real power of the modeling comes when we start to look at the impact of multiple factors.
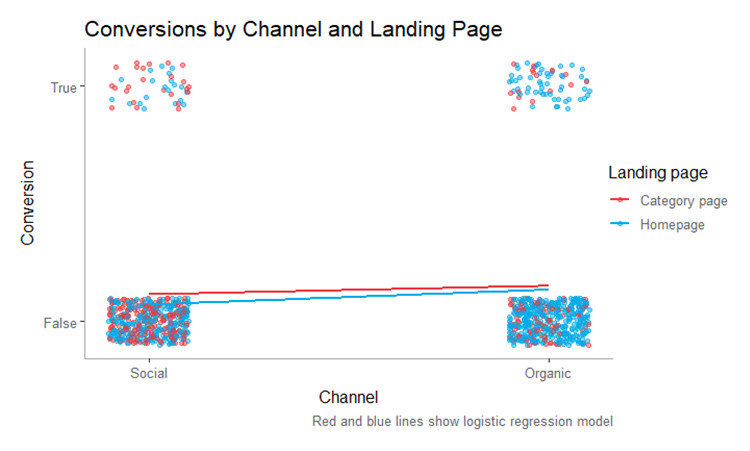
In the next example, we are interested in understanding the propensity to convert depending on whether a user visits our site from organic or social channels—and whether they land on our homepage or a product category page. Unlike our email example, we don’t have a numeric variable, so our plot shows four groups broken down by the color that represents the landing page type (note: we’ve added some noise to the location of the points so that they don’t sit one on top of the other):

Looking at the plot, we can see that there is an increased likelihood of conversion for organic traffic (the red and blue lines slope up from left to right) and that entrances on category pages is associated with an increased conversion probability (the red line is higher than the blue line).
Again, this is another simplistic example, but we’ve now shown that we can apply this technique to “categorical” variables—channel, landing page, customer-type, etc.—as well as numeric variables. By understanding the contribution of these touchpoints and behaviors in combination, rather than isolation, we can gain significant insight into how user behaviors impact conversion, and design experiments to test and improve user experience and performance.
Putting propensity modeling into practice
Having dipped into the basics of propensity modeling, it’s time to expand on that and look at an example that puts a propensity model into a business use case as part of a wider analytics and modeling process.
Let’s imagine that we run a video subscription service and we have a new member acquisition program, where prospective members can sign up to a three-month trial period. Our objective is to maximize the amount of revenue generated from trial subscribers moving to full memberships at the end of their three-month period.
When a subscriber joins, we will collect data against their membership, such as:
- through which channel they joined;
- what device type they use most;
- how often they use the service;
- which categories of video they stream most;
- how their use changes over the trial period;
- whether that subscriber was sent specific content or offers.
As we collect data across our cohort of trial subscribers, we will build a dataset of these features, along with whether or not that subscriber moved from the trial to an ongoing service. That gives us the data we need to build our propensity model: when a customer is two months into their trial, what is the likelihood that they will sign up for the full subscription?
Once the trial subscribers have been scored, we can look at, for example, a group of members that are unlikely to convert to the full service—then consider how to engage this group of users to incentive their conversion.
This example shows the role propensity modeling can play in business decision making. By understanding how likely an event is to occur, we can take action to change that likelihood and improve performance. We can also use propensity modeling to score leads, allowing resources to be better allocated to following up with those prospects.
An important concept to remember, though, is that this type of modeling may only be one component of the decision-making process. For example, a statistical model may be effective in predicting which users will churn and when, and there may be effective incentives that we know can reduce that likelihood. However, if the future value of that user is less than the cost of preventing their churn, then perhaps these incentives should not be implemented unless there are other factors to be considered, such as this particular member recommending the product to other users. In this case, the propensity model may be just one piece of a larger model that also includes lifetime value prediction and net promoter scores.
Final thoughts
Propensity modeling is an important tool in understanding how user engagement with a digital product can be used to predict particular outcomes. The ability to build robust statistical models to predict these outcomes is dependent on a measurement plan that establishes a foundation of tracking and makes these data readily available for analysis.
As these models are built on observational data, it is important to note that these models are correlative, with causation difficult to establish. However, for a number of use cases, correlation may be sufficient to make improvements to the product and improve user experience. For other cases, results of propensity models can be used to develop hypotheses that can be tested experimentally.
In this post, we’ve looked at two simple examples to outline the general approach, showing how we can use both numeric and categorical features to build models that allow us to predict the likelihood of an event. We haven’t looked at the statistics that power these models (a potentially massive topic!), but it’s enough to say at this point that the model building and validation process is critical.
With even data for a single source—such as Google Analytics—you can use propensity models to better understand performance and identify opportunities to grow. However, once you start to join your data across multiple sources and build modeling into your data strategy, the opportunities can lead to transformative outcomes.
Want to know how propensity modeling can impact your organization, or just want to talk more about that stats? Contact Proove today.
